
Basics of Radial Velocity Measurement
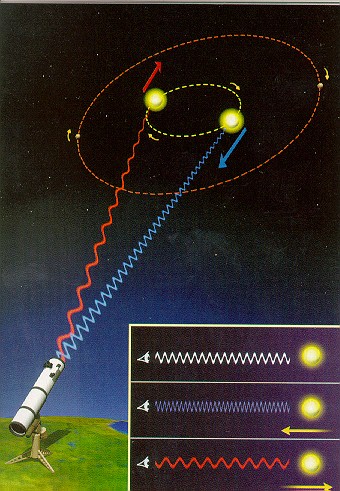
Radial velocity measurement is also known commonly as redshift and blueshift. If a light source moves toward or away from you, it changes frequency. Train horns do the same thing with sound. As a train passes the crossing, the horn noticeably changes pitch. If our eyes were sensitive to extremely small changes, we would see the train coming at us slightly bluer, and going away it would look slightly redder. A star’s gravity can be strong enough to keep a planet in orbit, but the planet is pulling on the star, too, and this tug causes the star to move back and forth. Because we can’t see the planet, the movement of the star is an alternate way to detect the presence of the companion.
In order to track these very small changes we rely on the positions of “markers” in the light. These markers can only be seen when you spread the light into a rainbow or spectrum. The white line in the above picture is a black and white image but is actually a very small section of the green part of a star’s spectrum. The missing black zones are called absorption features and are caused by elements in the star. These absorption features always occur at the same frequency (or position) unless the star is moving toward or away from the observer. The absorption feature will move less than 1 millionth of an inch if a planet is tugging on the star.
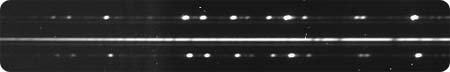
Since the movement is so small, we have to compare the star’s spectrum to something that is not moving. Shifts as small as a millionth of an inch can be caused by a 1 degree change in the spectrograph temperature or the barometric pressure. To overcome this, at the same time we feed starlight down the spectrograph fiber, we feed a second and third fiber with a reference lamp. Now if the temperature or pressure changes, it changes the reference lamp with it. To get the true shift in the starlight, we need to subtract the shift in the reference light. The above picture shows the dots from the reference lamp above and below the star’s spectrum.
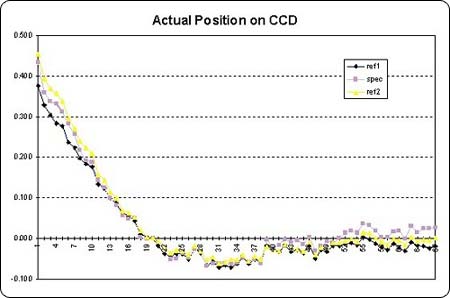
No matter how much we magnify the image, we would never see a spectrum shift 1 millionth of an inch. Fortunately there are mathematical formulas to do so. We use a standard method called Fourier Cross Correlation to compare the positions of the reference and star spectrums. The IRAF software has this as one of its programs and makes it easy. The above graph is a test run to see the effects of temperature on the system. The reference light was put down all three fibers, so we would not expect to see any shifts between the fibers. What we do see is a big change from temperature at first that evens out as the system stabilizes. The point here is that the three fibers follow each other closely, even though the temperature is shifting things around. To detect a star’s light shift you need two things: resolution better than 1 millionth of an inch, and a way to sort out the mechanical drift from the star shift.