October
The news for this month is the AP7b CCD from Apogee Instruments. We now have the new "b" model with the water cooling modification that brings the chip temp down to an actual temp of -50° C. The SiTe thinned chip with 80% quantum efficiency has taken our limiting magnitude down past 6.0 from 4.0. All spectrographs are starved for photons and this unit is a far better value than a bigger telescope. The current capability allows for more potential target stars with planets. 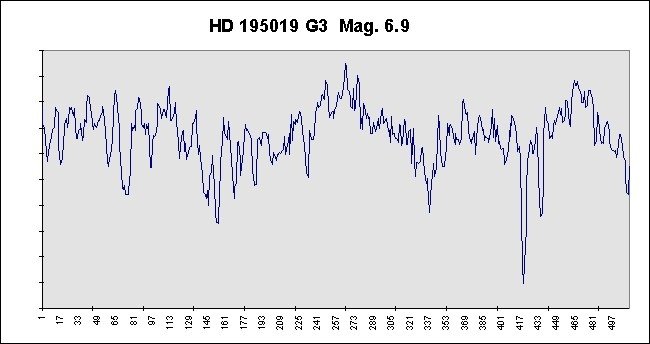
The spectrum at left is from the star HD195019, a 6.9 magnitude G3 star with a confirmed planet. It is a low signal-to-noise spectra at 0.4 ang. per pixel but represents our current magnitude limit. 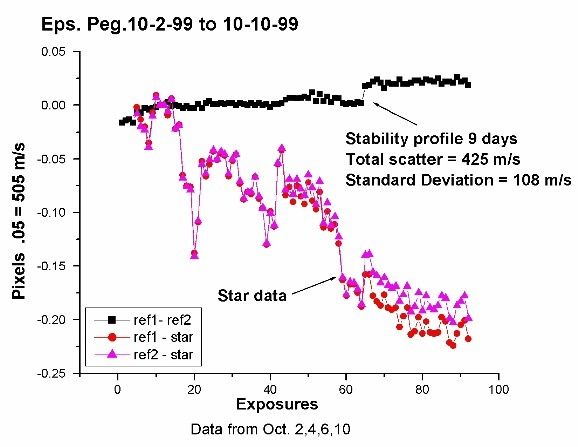
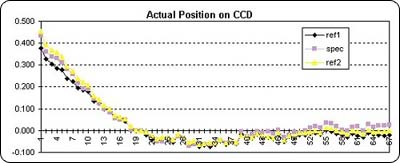
Until recently we have been working on efficiency and resolution issues. The graph at left is our first multi-day test for total drift. We utilize a cross-correlation technique that compares the first exposure to all the rest and tells you how much subsequent spectrums have moved relative to the first.
In a perfect world, the reference lamp spectrum from the first to the last day would be in exactly the same place, and then any movement of the star's spectrum would represent a true velocity shift. Of course, the reality is different, and changes in temperature and barometric pressure cause systematic drift. To measure this drift we focus the Thorium Argon lamp down two fibers, ref-1 and ref-2, and correlate their positions against each other the same way we would correlate ref-1 against the star fiber. The graph shows that the ref-1 to ref-2 total scatter is 425 m/s over nine days with a standard deviation of 108 m/s.
Detection of a star's change in speed must be substantially above this value to have any validity. At this time we do not have a sufficient handle on the math to tell what detection limit this represents. The star data shows that Eps Peg velocity as viewed from Earth changed by about two kilometers per second over this period due to Earth's orbit around the sun. 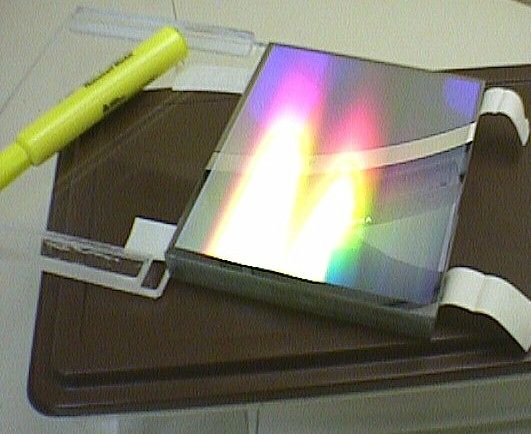
We have purchased a first quality grating from Diffraction Products in Woodstock, IL. A grating is the business end of every high-performance spectrograph and is used to disperse the spectrum. Dr. Ed Liebhard ruled a new master grating for us (280,000 lines) over two weeks. The current gratings are two inches square and are trying to reflect a three-inch beam, so a significant amount of light is lost at the edges. This new grating will capture all the light from the collimator, further improving efficiency. Dr. Liebhard was also kind enough to make us a special deal on the Echelle grating seen below. 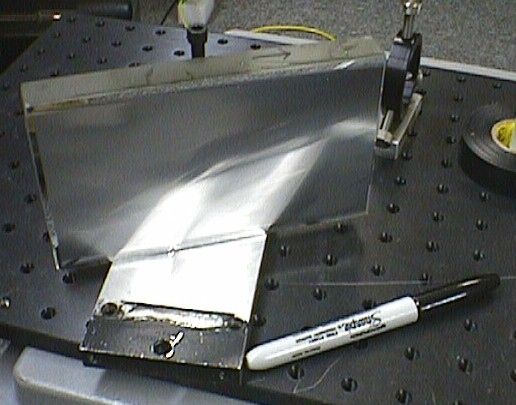
This type of grating is used in virtually every high-performance spectrograph in the world. Its main claim to fame is very high dispersion and a spectrum that is oriented in multiple stripes, much like the text on this page. 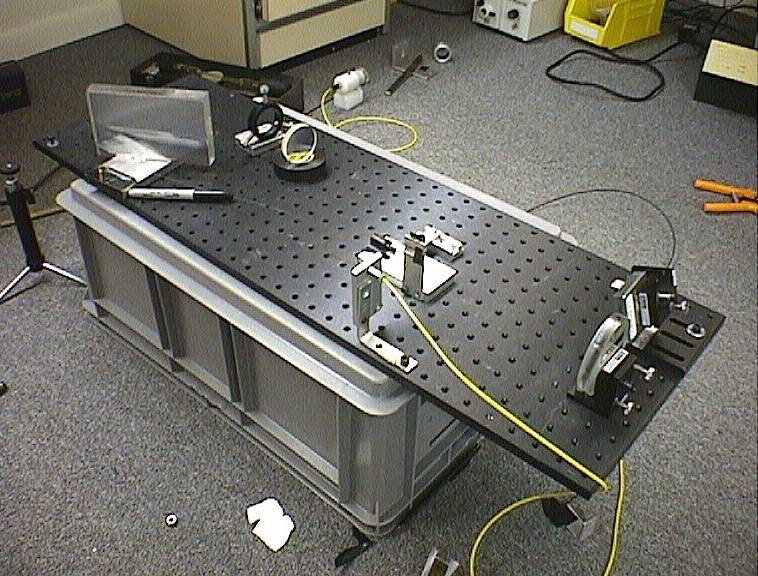
We are experimenting with this setup as shown in the picture at left, and very preliminary estimates show a possible resolution of 27,000, about double where we are now. We hope to construct a new system around it soon. 
One of the most common spectral lines seen by the average person is the yellow Sodium doublet. Since most people cannot picture the resolution of this spectrograph, we present this old favorite. The two lines are separated by six angstroms; here this means 75 pixels.
We were proud to have internationally renowned astrophotographer Don Parker visit our facility to view an observing run.
August - New Data Confirming Diurnal Motion
Diurnal motion is the rotation of the earth and can be easily visualized by imagining you are on the moon looking at the earth rotate. As you watch North America come over the horizon it first moves toward you as it rotates into full view and rotates away as it disappears again. A person on the earth would first speed toward the moon and then away again as the moon sets in the west. This velocity change caused by the earth's rotation is about 500 meters per second and provides a convenient method of measuring small shifts in radial velocity. 
The above graph shows the mathematically calculated diurnal velocity change for Arcturus. The area we are concerned with is outlined by the box. This is the velocity change seen during an average night last May. The following graphs show several nights' data showing the velocity shift detected by the spectrograph compared to the calculated shift from the previous graph. This data confirms the system's ability to consistently detect very small shifts in velocity for bright stars. 
![]()
![]()

The graphs above show the cross-correlation measurements of the radial velocity of the star as red squares. The red squares represent the change in position of the star's spectrum minus the change in position of the Thorium Argon spectrum (used as a reference) throughout the night; that is, a time series of the cross-correlation shifts of the Th-Ar lamp data (relative to the first lamp exposure on the night) are subtracted from the time series of the Arcturus cross-correlation shifts (calculated relative to the first Arcturus exposure on the night). This first step in the process corrects for most of the mechanical drift of the system. The red line is a linear fit to the "red square" star data points to give an averaged trend for the velocity shift.
All spectrographs experience mechanical flexure from thermal and other changes. This can be quantified by monitoring a reference lamp during the course of the observations - for the data presented here, this monitoring takes place at the same time as the star is being observed. There are three fiber beams, one for the star and two for the reference lamp. The beam paths do not progress identically through the system, and hence mechanical flexure or pressure changes can cause slightly different shifts in the reference and star beam paths, and hence differential shifts of the final spectra on the CCD. Some of this effect can be corrected by noting the difference in the drift as measured by fiber 1 and fiber 2. Halving this difference gives the correction, a quantity we term "correlation drift," to be applied to the "red square" data for a second order correction. The "correlation drift" is shown in the lower panel of each graph. The heavy black line is the linear fit to the star data with the correlation drift (from the lower panel) subtracted, and represents the "best estimate" of the change in the star's velocity over the night. The blue dotted line represents the mathematical calculation for the velocity shift, as shown in the Arcturus diurnal motion graph. The difference in gradient (in m/s per hour) between the heavy black and the dotted blue lines is a measure of the error in the measurements. The lines have been arbitrarily shifted vertically so they cross at the point during the night when the star was on the local meridian, and hence shows zero diurnal velocity shift. 
The AP7 has been put to use on the 4.5 magnitude star Tau Bootes and several velocity measurements have been made. This star is now low in the west at sunset and requires a half hour exposure to produce a low signal to noise spectra; we expect to do better when the star rises again next year. 
May
The big news in this update is the acquisition of a .4 meter (16") Meade LX200 scope. The usual six- to eight-month wait was alleviated by purchasing it from Stellar Vision Astronomy Shop in Tucson, AZ. Frank and Jeff made the purchase trouble-free and painless. This was probably the only large Meade in stock anywhere in the country. The scope spent a week in our machine shop undergoing modifications to the mechanical systems to make it appropriate for stellar spectroscopy. Special modifications were made to the focusing system to allow it to hold focus through 100 degrees of azimuth as well as a six-inch fork extension. Any institutions considering the purchase of this scope for CCD use should E-mail for modification details. Although we have limited exposure time with this scope it shows a fourfold increase in light gathering power. One would expect a 2.5 increase from aperture only, so we attribute the rest to better tracking with the 11" worm gears.
Since we are now attempting to measure velocity shifts below 1 Km/s we needed a method of testing the spectrograph at this level. We speculated that a laser bounced off a rotating mirror would induce known shifts. After discussions with several professionals we found out that a spinning disk with reflected light would in fact induce shifts and this was first done about the turn of the century. The system we built is capable of 300 ms but is producing strange results.
The spectrograph has undergone further modifications in a never-ending attempt to reduce the systematic error. The aluminum baseplate was replaced with a Cambrian black granite foundation. The granite base rests on foam rubber for 100% support. This reduces the thermal expansion by about half from the aluminum. The inside of the wooden enclosure and the top of the granite foundation have been lined with 3/4" foam for thermal insulation. The AP7 has been temporarily been replaced with the ST7 to take advantage of the smaller pixel size and water cooling. The CCD has been thermally isolated from its mount with Teflon pucks and foam insulated. Previously the CCD cooled the mount to a lower temp than the baseplate, adding to thermal instability. Additionally, a Cellotex foam box was fabricated to completely contain the wooden enclosure. This triple-layer insulation holds the temperature inside the enclosure to 64 degrees F +-0.2. Thermocouples inside the system show that the temperature takes almost a day to stabilize and once at temp shows virtually identical temperatures between the granite base and CCD mount. We realize that stopping thermal drift is impossible, but the goal of the extensive insulation is to get things to move slower. Holding the temp farther below ambient seems to make it less susceptible to temperature changes in the room. The following graph shows the drift of the spectrum across the CCD face and shows the cool-down and stability phase over about 10 hours. The drift was Fourier cross-correlated using the Thorium Argon lamp down the reference and stellar fibers. With nine micron pixels the later part of the graph represents less than 3 microns of position drift over five hours. ![]()

A Hamamatsu photo multiplier tube has been mounted in the light path of the dispersed spectrum. Labview records the 5 ns pulses from the system and graphs the frequency per second as well as total counts. This system will be used to monitor atmospheric transparency and determine consistent exposure times. The PMT is unbelievably sensitive and can count individual photons.
Data:
We are working with IRAF exclusively at this point using Fxcor to do Fourier cross correlations. Fxcor can detect very small shifts between spectrums with accuracy well below 1000 meters per second. A second reference fiber has been added below the stellar cluster. The ref1 and ref2 fibers allow triple correlation the data; this tells us if the system is stable during the stellar exposures and gives an indication of the noise contribution. The graphs now show three plots. The first is ref1 correlated against ref2 and shows the system stability throughout the run. The second and third plots are ref1 to stellar fiber and ref2 to stellar, giving us an indication of how good the signal to noise is from the star exposure. If the S/N is too low, instead of these two plot points being on top of each other they start drifting apart. 
Most of the observing time has been spent on Arcturus doing sequential exposures from dusk to 3:00 am trying to detect diurnal motion. This is a shift in velocity through the night of about 500 meters per second due to earth's rotation. The observing is scheduled as follows: the system is cooled down for 24 hours before the run and about 10 hours before dusk, the Thorium Argon lamp is injected down all the fibers to expose reference frames continuously right up to the switch to Arcturus. The star is tracked all night, taking exposures every 10 minutes, and at the end of the run the system is put back on the reference lamp exposures for another 6 to 7 hours. The following graph shows preliminary results for the first good run (we have been having a lot of bad weather). In the graph below, .01 pixels is equal to 90 meters per second velocity.
The entire system, telescope and spectrograph, is being shipped to Wyoming for a month's observing in black skies at 5000 ft. This will be a test of how faint the system can go with good enough S/N to maintain sub. K measurements.
March - Many new modifications to the spectrograph:
Replaced ST7 with AP7 CCD 512x512 SITe 24 micron chip, more than double the QE and cooling. Sent in ST7 for water cooling modification. The 24 micron pixels required changing the camera mirror to 30"fl for a final dispersion of 0.24 ang/pix. Added aluminum cooling block to the spectrograph box and installed a closed circuit water pump and chiller to cool the system to 4 deg. above ambient. Removed the rubber feet on the spectrograph chassis and replaced with a full-length foam pad for 100% support of the chassis. Added a diffusion window on a remote controlled slide for proper flat field exposures. Installed a Thorium-Argon lamp for reference lines. A Hamamatsu photo multiplier tube is on order to be used as an exposure meter.
Software:
IRAF has become more useful and is now the primary reduction method. The Labview software is now in its final version and can handle multiple formats and image sizes. Lev-Mar Gaussian analysis has been added, but this still only uses one peak in each spectrum.
Performance analysis:
Most of the errors associated with radial velocity measurements are from the system itself. Drift in the system is primarily due to thermal problems and constitutes the majority of the error. A great deal of time has been spent analyzing the shot to shot consistency of the system along with the temperature stabilization profile. It was found that the system needed a minimum of five hours after startup to heat soak and stop drifting in one direction. The addition of the cooling system stabilizes the final temp six degrees lower than before and holds the system to +- 0.5 degrees. Careful tracking of the grating and chassis temp shows that most of drift is in the CCD housing itself. Once stabilized, Fxcor in IRAF was used to compare the first exposure to subsequent back-to-back exposures. The difference between the position of the reference apertures minus the stellar apertures shows a standard deviation in the range of 0.024 pixels, showing that the two apertures are highly correlated. The AP7 camera now makes it possible to hit a mag. 4.5 star like Tau Bootis in a 30-minute exposure.